•Troubleshooting Published Action Level Crosstabs
A Crosstab report can be created from any EQuIS Professional grid report output.
Notes: •Crosstab reports can potentially be created from any data in EQuIS Professional grid output such as tables, views, or even output from another Crosstab. However, non grid report data are not fully supported and not all features may be available or work correctly. •In some cases, using a single "custom" filter on a column can also lead to an export that is incomplete. Specifically, if a custom filter includes a condition based on another field in the table, then the filtered results may not be exported in their entirety. There may be additional conditions that lead to this behavior as well. At this time, we advise against using custom filters prior to clicking the Crosstab button. |
The example shown here uses the Analytical Results II Report on the Springfield data using the following parameter selections.
Parameter |
Selection |
|---|---|
Location Group |
MonitWells |
Sample Matrix |
WG |
Result Analyte Group |
_PERC DAUGHTERS |
Result Unit |
ug/L |
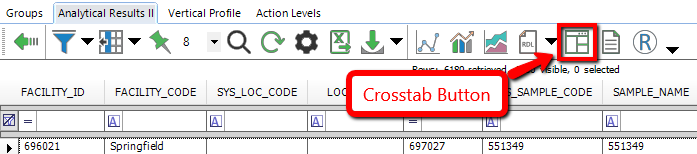
To create a Crosstab report from the grid report output in EQuIS Professional, click the Crosstab button as shown below.
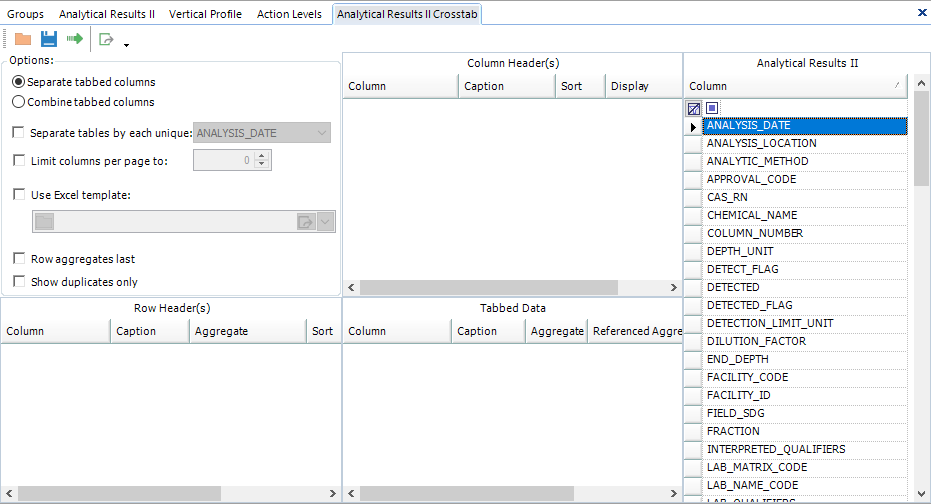
This opens the Crosstab Configuration Form, which is shown below.
Configuring the Crosstab
The Crosstab Form has the following sections.
Available Columns
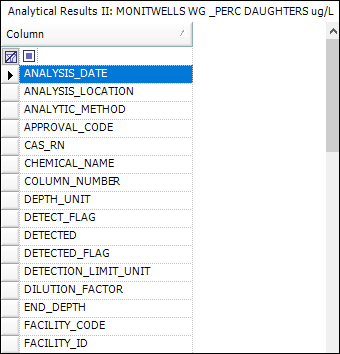
All of the fields that can be selected for the report are shown in the Available Columns list below the Report Name as shown above. A search bar at the top of the list can be used to quickly find fields from the report.
Notes: •In previous versions, the top label for this section displayed Available Columns. This has been changed. The label now shows the name of the report from which the Crosstab report is being created. It will either be the System report name, the System report name with the appended parameters or the saved user report name, if used. •Please add multiple REMARK fields to your base report if you would like a REMARK field available in a crosstab. The REMARK column is available in many tables; when a single REMARK column is added as an Additional Field to a base report, the added REMARK field is not included in the list of fields available in setting up a crosstab. When multiple REMARK fields from different tables are included as Additional Fields, they will automatically be given unique names (formatted as TABLE_NAME_REMARK) and be available in the crosstab selection list. |
Use the drag and drop feature to place the desired fields in the appropriate location (Column Header(s), Row Header(s) or Tabbed Data section). Select multiple fields by using the Shift and/or Ctrl buttons on the keyboard while selecting fields.
This example uses the following report columns in the following sections.
Parameter |
Selection |
|---|---|
Column Headers |
CHEMICAL_NAME |
Row Header |
SYS_LOC_CODE SYS_SAMPLE_CODE |
Tabbed Data |
REPORT_RESULT_TEXT REPORT_RESULT_UNIT |
Remove any field that has been added to a section by selecting the field in that section and clicking the Delete key. A confirmation dialog will appear to make sure you want to delete that field from that section.
Column Header(s)
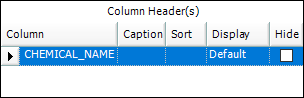
Each column header will appear as a row across the top of the resulting report for every unique combination of column header values in the report.
The help article Column Headers and Row Headers offers information related to the options in this section.
Row Header(s)
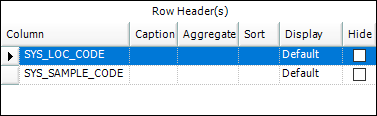
Each row header will appear as a column down the left side of the resulting report for every unique combination of row header values in the report.
The help article Column Headers and Row Headers offers information related to the options in this section.
Tabbed Data
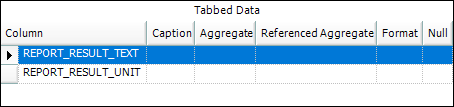
The fields selected in the Tabbed Data section make up the body of the report. Each selected field will appear as a column for each corresponding distinct column header value. Each row in these columns will be ordered according to the corresponding row header values.
The help article Tabbed Data offers more information related to the options in this section.
Options
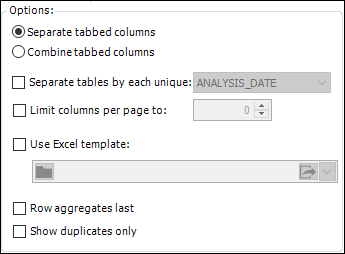
The crosstab output may be further customized here. The help article Options offers information related to the options in this section.
Running the Crosstab
Click the Go ![]() button to run the Crosstab.
button to run the Crosstab.
In this example, the following Crosstab report is the result. It outputs to a single grid table including the CHEMICAL_NAME column headers at the top, the SYS_LOC_CODE and SYS_SAMPLE_CODE row headers to the left of the main report columns, and the REPORT_RESULT_TEXT and REPORT_RESULT_UNIT tabbed data columns per each column header value.
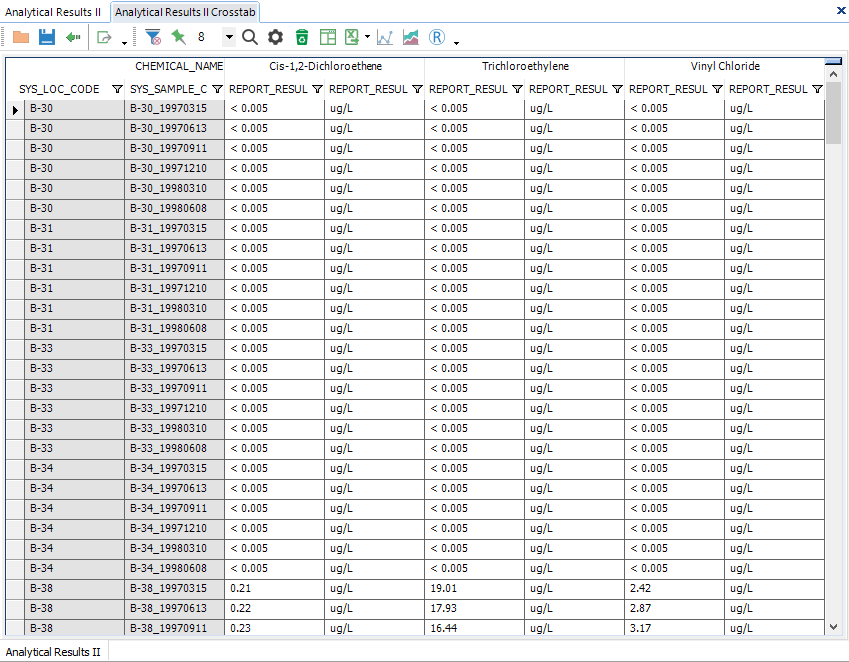
Note: When you run the crosstab, you may find what appear to be duplicate values in the tabbed data section of the crosstab. These cells will be highlighted in the Crosstab report as shown below.
 Duplicate Values
This can occur when a value that would make a result unique (i.e. SYS_SAMPLE_CODE, FRACTION, START_DEPTH, MATRIX, SAMPLE_DATE, etc.) is not utilized in either the Column Header or Row Header sections of the crosstab. Duplicates will not necessarily have the same value.
To resolve this, return to the Crosstab configuration, and add a Column Header or Row Header to make these values distinct.
If you do not want to add any further row or column headers to distinguish the values in the tabbed data, use an aggregate to have a single value. |
Other Crosstab Actions
The toolbar at the top of the Crosstab Form and output provide the following functionality.
Config Toolbar: ![]() Output Toolbar:
Output Toolbar: ![]()
Button |
Name |
Config / Output |
Description |
||||||||||||||
|---|---|---|---|---|---|---|---|---|---|---|---|---|---|---|---|---|---|
|
Open |
Both |
Open a previously saved Crosstab configuration (*.xml file). |
||||||||||||||
|
Both |
Save the current crosstab configuration for later use. |
|||||||||||||||
|
Go |
Config |
Run the Crosstab (create Crosstab table(s) based on current configuration). |
||||||||||||||
|
Go Back |
Output |
Go back and view/edit the current Crosstab configuration. |
||||||||||||||
|
Both |
Publish the Crosstab report to the database. Clicking this will open the Crosstab Publisher Form. |
|||||||||||||||
|
Filter |
Output |
Adds filters to table column headers |
||||||||||||||
|
Removes filters from the columns |
||||||||||||||||
|
Pin |
Output |
Pin columns for easier horizontal scrolling within Crosstab Report. |
||||||||||||||
|
Find |
Output |
Find and Replace tool |
||||||||||||||
|
Properties |
Output |
Opens a Properties pane to the left of Crosstab output. The Properties pane displays advanced display options for the currently selected row, column or cell in the Crosstab output table. |
||||||||||||||
|
Release |
Output |
Release source data to reduce memory usage. |
||||||||||||||
|
Crosstab |
Output |
Create a crosstab from the current output. |
||||||||||||||
Various |
Export |
Output |
Export buttons only show one at a time. Click the down arrow next to the displayed export button to see the full list of export options.
|
||||||||||||||
|
XY Chart |
Output |
Click to create an XY chart with crosstab results. Refer to the help articles below for more information about XY charts.
•XY Chart Basics: Create, Clear, Save & Load Charts and Parameters |
||||||||||||||
|
XYZ Chart |
Output |
Click to create an XYZ chart with crosstab results. Refer to the help article Create and Export XYZ Chart for more information about XYZ charts. |
Troubleshooting Published Action Level Crosstabs
It is possible to use a single saved crosstab configuration (either as a locally saved .xml or published to the database as a user report) and interchange the action levels included in the base report or input parameters. However, there are limitations to the crosstab configuration when this is done. When creating crosstabs with more than one action level, the following suggestions should help ensure that the crosstab configuration can process various action level inputs:
•Include the “regular” action level column (i.e. the one that is named [Your Action Level's name]_action_level) for all action levels in the configuration, even if it is not populated.
•Include the same combination of action level columns for each action level. For example:
oActionLevel1_action_level
oActionLevel1_action_level_min
oActionLevel1_action_level_desc
oActionLevel2_action_level
oActionLevel2_action_level_min
oActionLevel2_action_level_desc
If users continue to encounter "mismatch" errors when using different combinations of more than one Action Level in a published crosstab, you can use an ST_CONFIG setting to remove action level captions as detailed here. The following steps can also be used to modify the published crosstab to replace references to specific action levels with a generic names:
1.1. Follow the Manual Method of opening a published crosstab to create an XML file for the crosstab configuration.
2.Open the *.xml file created, edit as follows:
a.Find the <rowHeaders> section (near the end).
b.For each action level header, replace the name of the action level with a number, and replace the Caption row with "<Caption />". For example, change your existing:
<Column>Industrial Groundwater_action_level</Column>
<Caption>Industrial Groundwater</Caption>
to:
<Column>1_action_level</Column>
<Caption />
c.Repeat this for each action level header (and caption), numbering them sequentially, 1_action_level, 2_action_level, etc. for each action level in the saved configuration.
d.Save.
3.Within the EQuIS Blobber Form, click Update and select the edited *.xml file.
After following the steps above, the published crosstab should accept different sets of action levels without error, as long as the number of action levels in your parameter matches the number of action levels in the crosstab configuration.
Note: The workaround described above may not provide the desired output if your row headers include an action level FLAG or WARNING_FLAG column. |