You can highlight Detected results in a Crosstab report. This is done using the same mechanism that is used for highlighting Action Level Exceedances and can be done on any report that outputs a DETECT_FLAG column.
Note: A Detected result is considered any result where the DETECT_FLAG value is "Y" or "TR". |
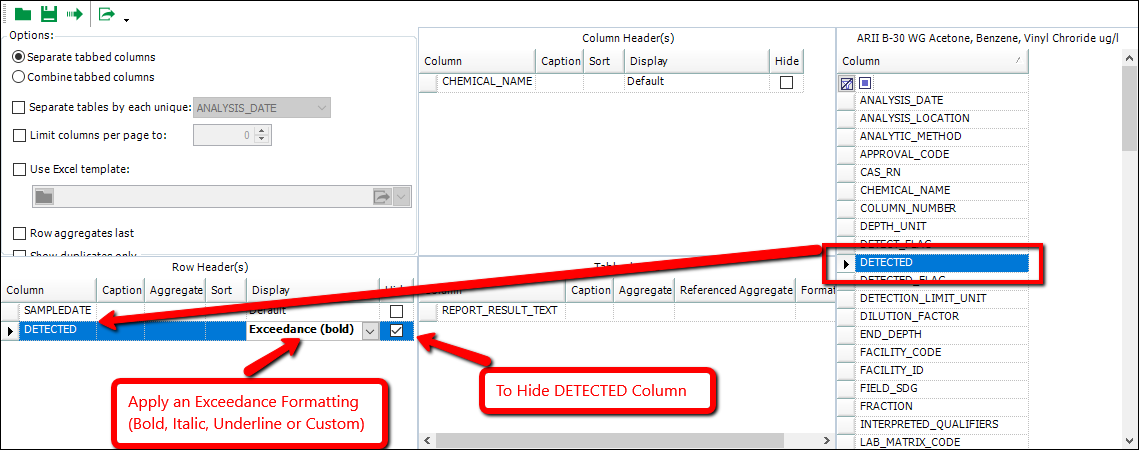
To do this, add the DETECTED column from the available columns to either the Column Header(s) or Row Header(s) panels in the Crosstab Configuration Form, and then apply an Exceedance formatting. Since the DETECTED column will be empty (no values are associated with it), you will likely want to hide this column.
Notes:
•You can add the DETECTED column once to each of the Row Header(s) and Column Header(s) panes to combine Exceedance formatting. However, you can not add it more than once to either pane. •As mentioned previously, this feature works by using the same mechanism that is used for the Action Level Exceedance formatting. To utilize this feature, whenever the report contains the DETECT_FLAG column, the DETECTED and DETECTED_FLAG column are added to the underlying report's columns that you can choose from in the Crosstab configuration. The DETECTED column is an empty column. The DETECTED_FLAG column has a flagged value for every DETECT_FLAG "Y" or "TR" value. When the DETECTED column is added to a header pane, the Crosstab then uses the DETECTED_FLAG column to know which report values are detections (as opposed to non-detect values). |