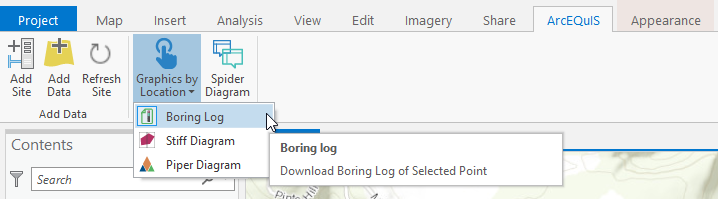
 The ArcEQuIS add-in for ArcGIS Pro includes the Graphics by Location button, which can be found in the top ribbon of ArcGIS Pro under the ArcEQuIS tab, in the EnviroInsite Graphics section. This button allows users to click points on the map to dynamically generate EnviroInsite graphics, such as boring logs. The ability to generate additional types of graphics will be added in future builds.
Graphics for the selected point(s) are downloaded to your PC as .pdf files and will automatically open when they are finished being generated. By default, they will be saved to the following location:
C:\Users\[Your User Name]\Documents\ArcGIS\Projects\[Your ArcPro Project Name]\EQuISDownloads
Prerequisites
Before generating graphics by location from ArcGIS Pro, users need to have the following prerequisites in place (in addition to those required for ArcGIS Pro and the ArcEQuIS add-in):
1.Install a .pdf viewer such as Adobe Acrobat Reader on the computer running ArcGIS Pro.
2.Install EnviroInsite (and prerequisites) on your EQuIS Enterprise server as detailed in the EQuIS Enterprise section of the help page here. Note that this will not require an EnviroInsite license. The EnviroInsite_Enterprise_package_x64_{version #}.zip file will be available on the EarthSoft Community Center Downloads Dashboard, regardless of whether or not an EnviroInsite license has been purchased. EarthSoft hosted clients (those with an EQuIS Enterprise site hosted by EarthSoft, generally with an equisonline.com URL) can contact EarthSoft Support to have EnviroInsite installed on their EQuIS Enterprise server.
3.The EarthSoft.Reports.Library.EnvironInsite.dll needs to be published to the database in EQuIS Professional. Specifically, the EnviroInsite Boring Logs, EnviroInsite Cross-Section, EnviroInsite Piper Diagram and EnviroInsite Stiff Diagram reports.
4.Graphics require either a saved user report or a saved template WITH THE EXACT NAME detailed in the table below. Example templates are provided below and included with EQuIS Professional (Examples folder), if the Example Files option is checked during installation. Different templates can be created in EnviroInsite and used as long as they use the correct naming convention. Templates should be uploaded to DT_FILE via the EQuIS Professional Docs and Photos Form or the Enterprise Explorer Widget. Saved user reports should be created in the corresponding base report listed below.
5.There are certain data requirements needed for these EnviroInsite graphics. Check the corresponding documentation pages listed below for these data requirements.
Graphic |
Template vs User Report |
Required Name |
Location |
EnviroInsite Data Requirements |
Example |
Boring Logs |
Template |
EIBoringLogTemplate.xml |
DT_FILE |
||
Stiff Diagram |
User Report |
EIStiffDiagram_ArcEQuISTemplate |
Saved as user report in EnviroInsite Stiff Diagram Report |
||
Piper Diagram |
User Report |
EIPiperDiagram_ArcEQuISTemplate |
Saved as user report in EnviroInsite Piper Diagram Report |
||
Cross Sections |
Template |
EICrossSectionTemplate.xml |
DT_FILE |
|
Boring Logs
Generate Boring Logs
Generate boring logs in ArcEQuIS by following these steps:
1.In ArcGIS Pro, open a new or existing Map project and connect to an EQuIS facility.
2.Use the Add Data button under the ArcEQuIS tab to add a Locations Point or Polygon layer to the map.
3.Navigate to the Graphics by Location button (under the ArcEQuIS Tab). Click the drop-down arrow and select Boring Log:
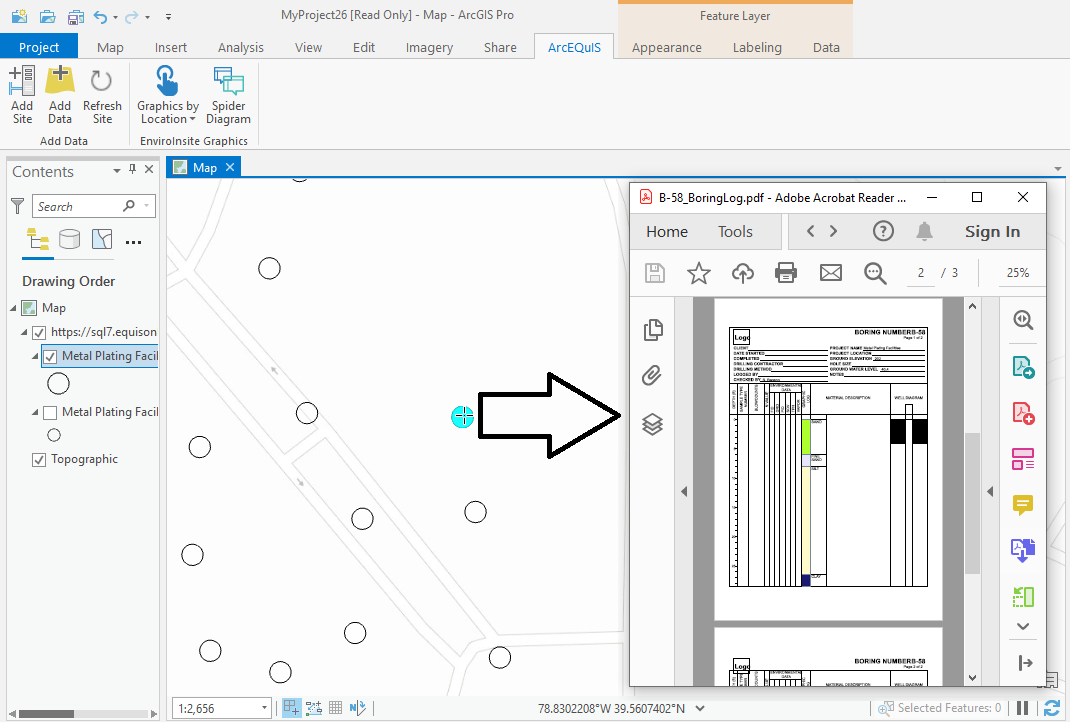
4.The cursor should change to this crosshair ![]() . Click a point to generate a .pdf boring log for that point:
. Click a point to generate a .pdf boring log for that point:
Note: If there are multiple overlapping points or you are zoomed out far enough that multiple points are rendered as a single point, click that point to generate boring logs for all the points there. |
|---|
Boring logs will be saved with the following naming convention:
[SYS_LOC_CODE]_BoringLog.pdf
Note: If a boring log is generated for the same point multiple times (without changing the file location or name of the existing log), the new log will overwrite the existing log. |
|---|
5.To exit the Graphics by Location tool, select another tool such as the Explorer tool, available under the Map tab on the Top Ribbon.
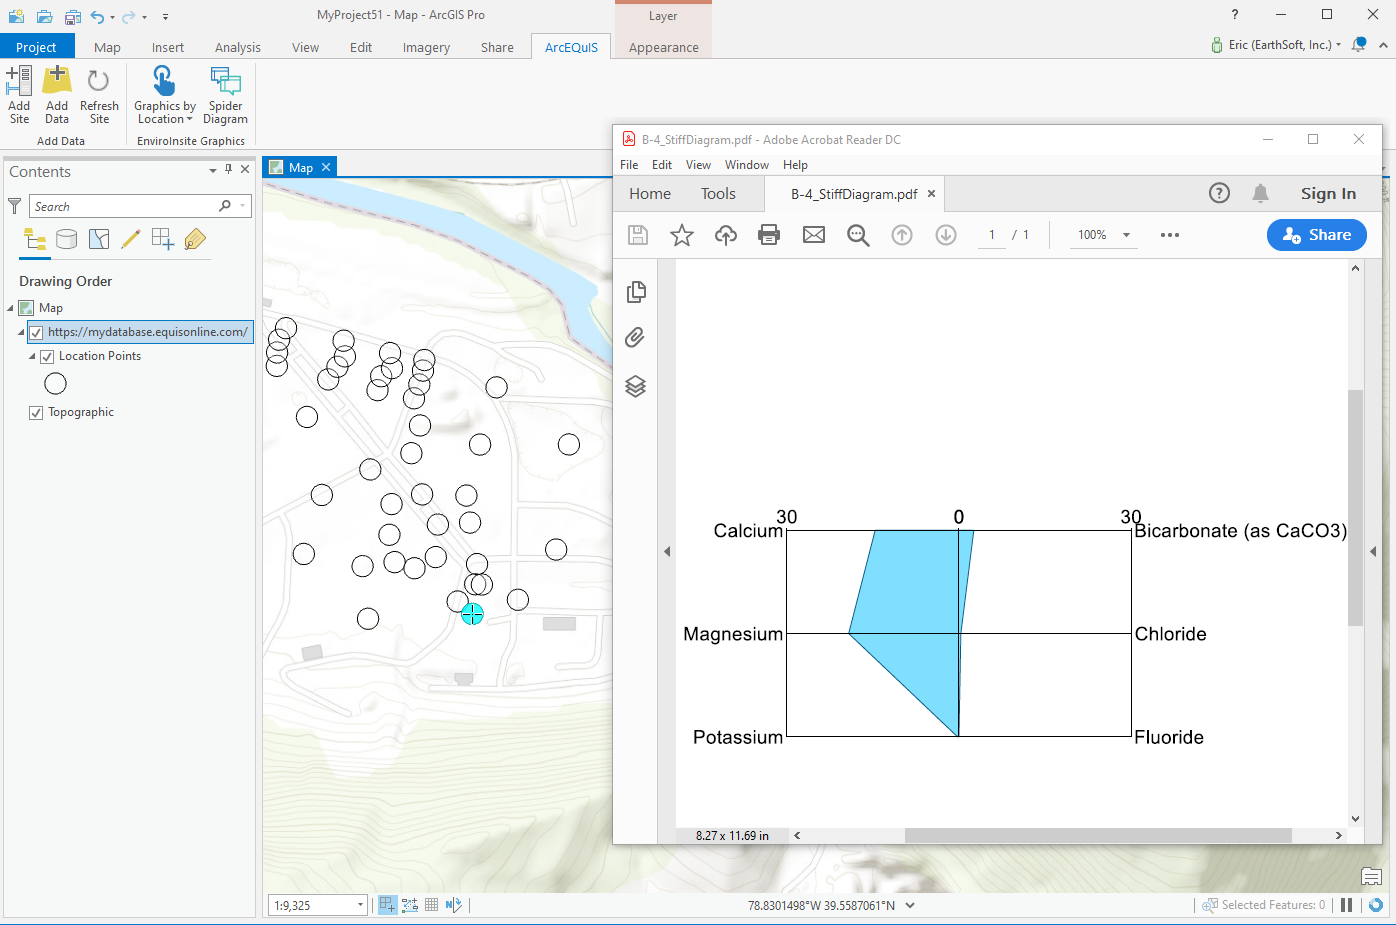
Stiff Diagram
To generate a Stiff diagram, use the same steps outlined above for boring logs, but just select Stiff Diagram for the Graphics by Location drop-down. Once you select a point, a .pdf Stiff diagram will be generated and downloaded to your computer, and will be saved with the following naming convention:
[SYS_LOC_CODE]_StiffDiagram.pdf
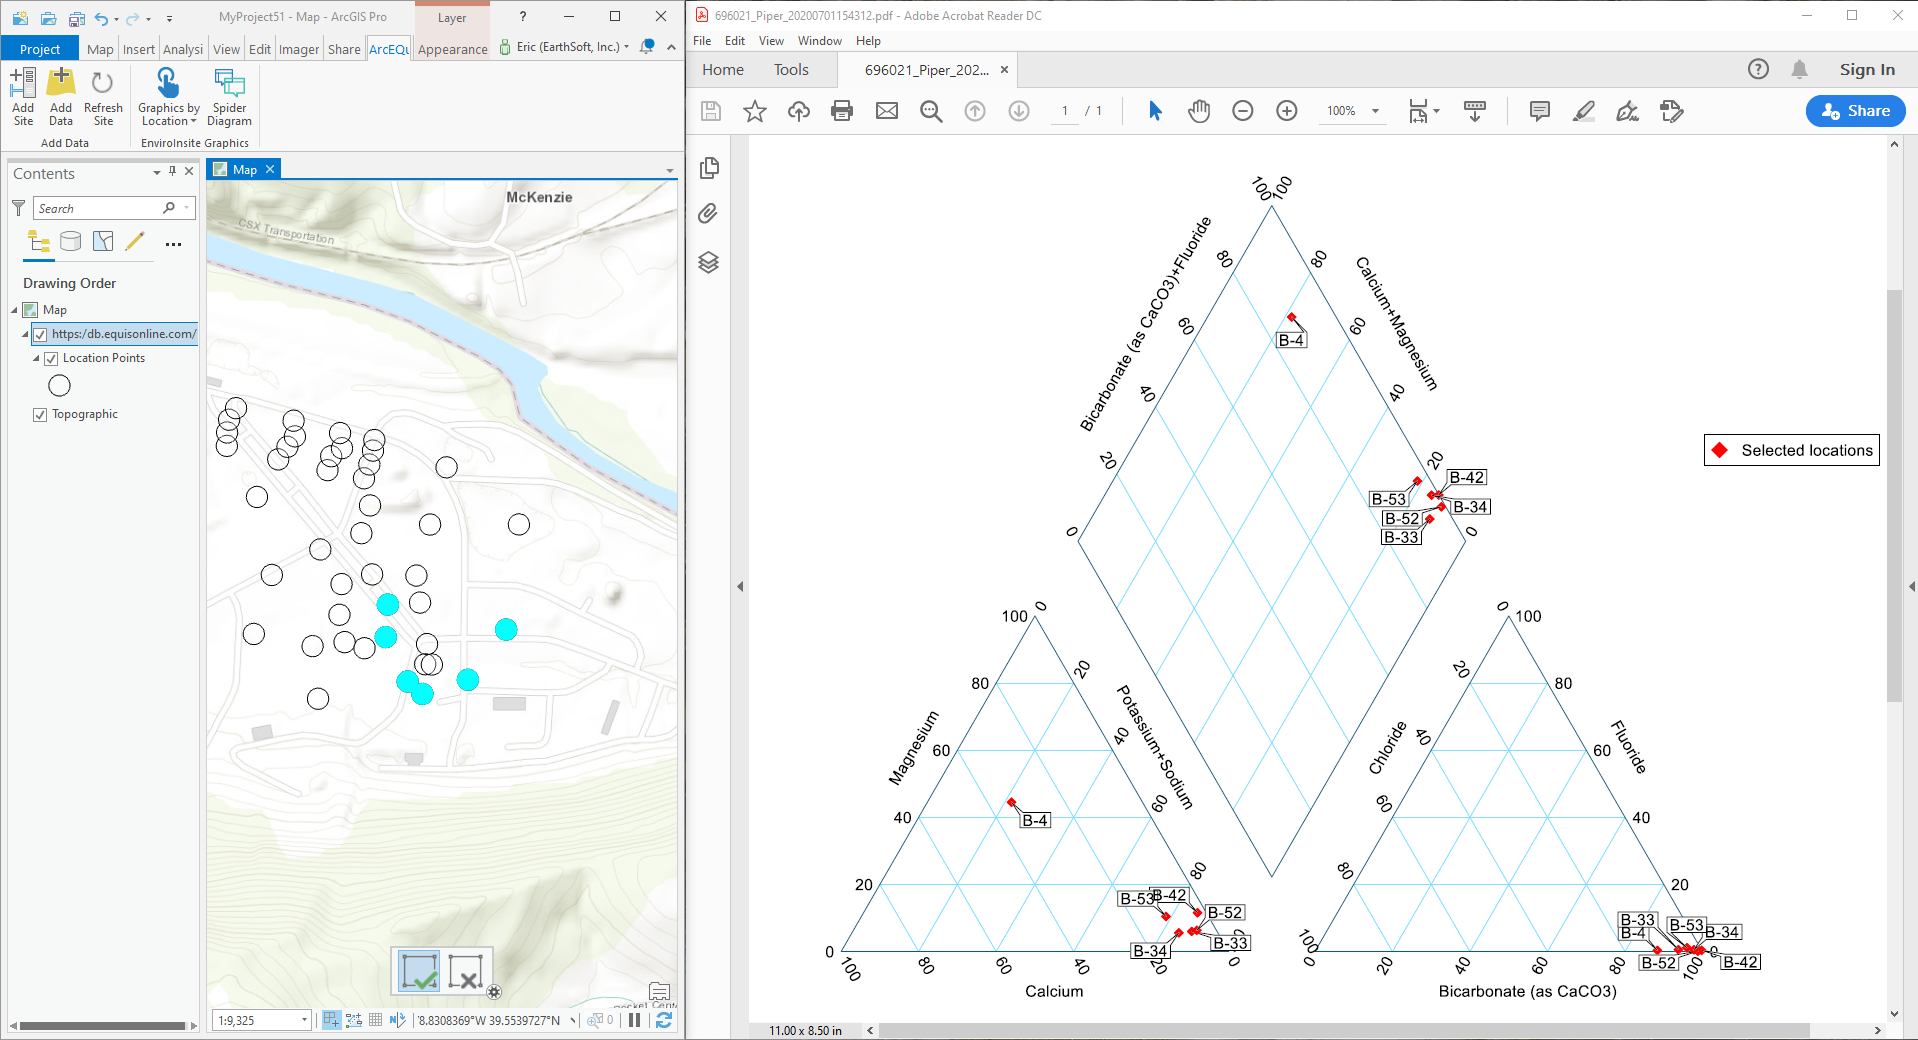
Piper Diagrams
Piper diagrams can be generated using the same steps as boring logs and Stiff diagrams with the primary exception that for piper diagrams you can select multiple points. The steps to generate piper diagrams are as follows:
1.In ArcGIS Pro, open a new or existing Map project and connect to an EQuIS facility.
2.Use the Add Data button under the ArcEQuIS tab to add a Locations Point or Polygon layer to the map.
3.Navigate to the Graphics by Location button (Under the ArcEQuIS Tab). Click the drop-down arrow and select Piper Diagram.
4.The cursor should change to this crosshair ![]() . Click on the point(s) you would like to have included in the Piper Diagram. Two small curved lines will be displayed at each of the places you click as shown in this example point:
. Click on the point(s) you would like to have included in the Piper Diagram. Two small curved lines will be displayed at each of the places you click as shown in this example point: ![]() .
.
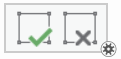
5.When you have clicked on all the points you would like included in your diagram, click the Finish button (left, green check). If you would like to change your selection you can click the cancel button (right, grey x) and make new selections.
Once the Finish button is clicked, a new .pdf Piper Diagram will be generated, downloaded to your computer, and will open automatically. It will be saved with the following naming convention:
[FACILITY_ID]_Piper[date-time string of current time].pdf
Note: There is a known issue when clicking the Finish button without making selections. If nothing is selected before the Finish button is clicked, ArcGIS Pro will crash. |
|---|
Cross-Sections
Geological cross-section diagrams can be generated using the same general steps as other Graphics by Location with the primary exception that for cross-sections the user must draw a line on the map to identify the cross-section to generate. The steps to generate cross-sections are as follows:
1.In ArcGIS Pro open a new or existing Map project and connect to an EQuIS facility.
2.Use the Add Data button under the ArcEQuIS tab to add a Locations Point or Polygon layer to the map. The Facility Locations layer needs to be the top layer in the Contents Pane.
3.Navigate to the Graphics by Location button (Under the ArcEQuIS Tab). Click the drop-down arrow and select Cross-Section.
4.Draw the line you would like to use to create the cross-section on the map. Note that the line may only contain up to 6 points (2 end points and up to 4 intermediate points). To end the cross-section segment, double-click the end point.
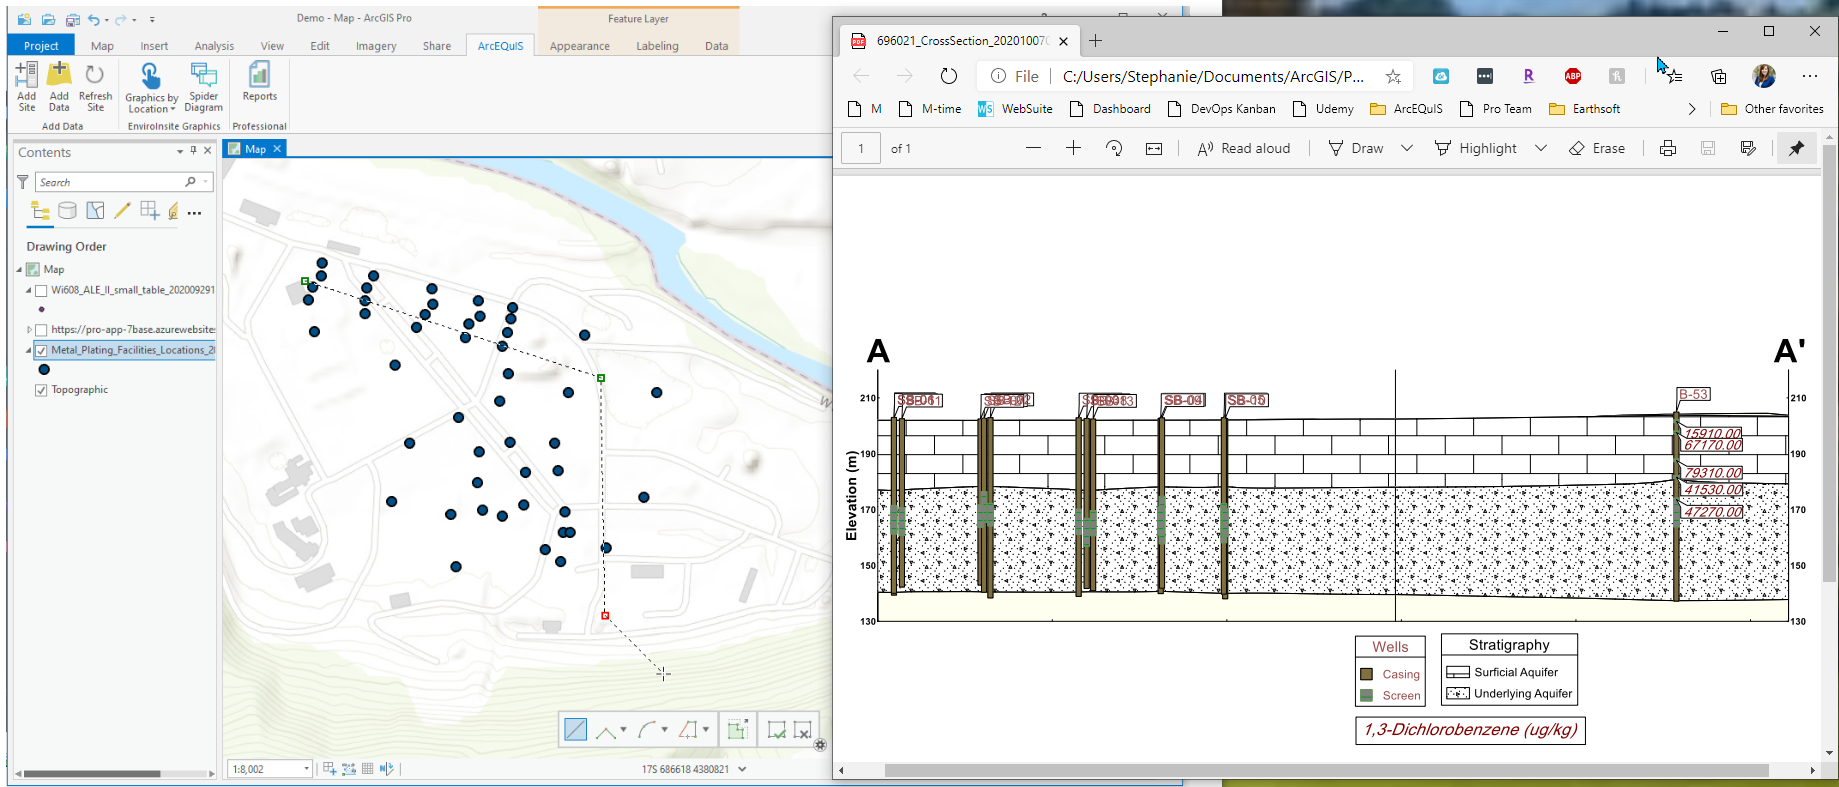
Once the point is double-clicked, a message will appear stating “Graphic is being generated” then a new PDF Cross-Section diagram will be generated, downloaded to your computer, and open automatically. It will be saved with the following naming convention:
[FACILITY_ID]_crosssection_[date-time string of current time].pdf
The cross-section will by default use the ArcGIS Aerial Photo when generating the overview map in the diagram. In the example template, any wells within 25 feet of the cross-section line (measured once converted to UTM coordinates) will be displayed on the diagram. This buffer distance can be set in the template itself if it is edited or created in EnviroInsite.
Note: A large number of locations may slow down the generation of the Cross-section PDF file. |
Note: The cross-section may not generate if it is not zoomed to the extent of the location point layer. To zoom to the extent of the layer, right-click on the layer and select “Zoom to extent”. |
Troubleshooting
If you receive a "Graphics are being generated" message, but no graphics ever appear, please try the following:
1.Wait. Depending on the number of locations in your database it may take several minutes for graphics to be generated.
2.If you are using version 2.6.3 of ArcGIS Pro, please update to 2.7.0.
3.Confirm that you have met all the conditions covered in the Prerequisites section above. Specifically, that you have an appropriately named and located template file, and that EnviroInsite has been installed on your Enterprise server.
If ArcEQuIS exports a graphic, but it is blank or missing data, the underlying data required to generate the figure may not be present in the database. You can check the underlying "EnviroInsite..." report that is being used in EQuIS Professional, and update the template files (covered in the Prerequisites section above) accordingly.
For Piper diagrams, ensure that the three analytes used in the report have data for the location(s) you are using in your plot, and that equivalent weights for each are populated RT_ANALYTE_DETAIL.EQUIVALENT_WEIGHT fields. To ensure all the required data is present, run the Analytical Results II report for the analytes where RT_ANALYTE_DETAIL.EQUIVALENT_WEIGHT is populated. Then review this output to make sure there are:
•at least six analytes (three cations and three anions) that contain data from the same sample are chosen.
•DT_RESULT.RESULT_UNIT can not be null for any of the selected analytes,
•DT_TEST.FRACTION should match across the selected analytes and this FRACTION should be selected as a parameter, and
•there are not duplicate records in RT_ANALYTE.CHEMICAL_NAME for any of the selected analytes.
For cross-sections, make sure that the extents (X_MIN, X_MAX, Y_MIN and Y_MAX) in DT_FACILITY are set correctly. These are used as the extents for the inset overview map, and if they are incorrect can result in an invalid output.