The Office Hour on Plotting Locations and Spider Diagrams for EQuIS for AutoCAD can be viewed on YouTube.
Plot EQuIS Action Level Exceedance Report Spider Diagrams in AutoCAD
1.In EQuIS Professional, save an ALE II User Report to the database.
2.Create a crosstab configuration and make sure that Separate tables by each unique: SYS_LOC_CODE is selected in the options.
a.EQuIS for AutoCAD supports the use of templates within the crosstab configuration.
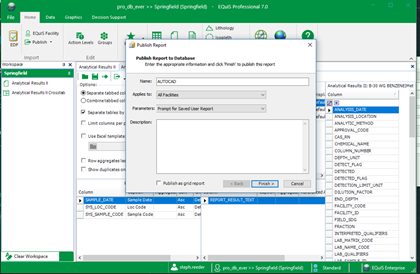
3.Publish the ALE II Crosstab Report parameter settings in EQuIS to the database (do not publish as grid report).
4.In AutoCAD, click Plot Spider Diagrams after connecting to the EQuIS Database with published report/user report.
5.Select the desired Crosstab report from the drop-down list.
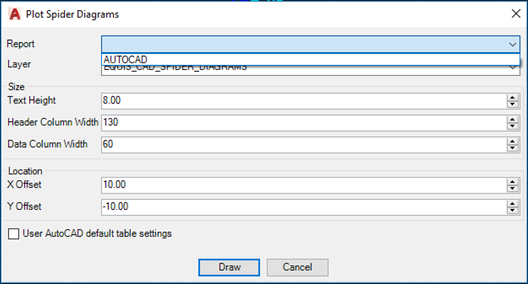
6.Select layer, size (label), location offset from plotting table and click Draw.
7.Select the desired saved ALE II User Report and click Go.
8.Optionally, click Add Leader Lines to draw lines from the locations to the associated tables.
Additional Information: Any Spider Diagram table that is repositioned from its original location will retain its new xy position in AutoCAD when running a new report and/or crosstab as long as the Spider Diagram table is not erased in AutoCAD. |
Draw Spider Diagrams for Existing Locations
The Draw Spider Diagrams function will draw all available tables on the current drawing at their appropriate location by default. An option can be set to only draw tables for locations that are present (already positioned on the diagram by the Draw Location function).
To edit this setting, follow the instructions below.
1.Locate the EarthSoft settings.xml within the directory C:\Users\[user_name]\AppData\Roaming\EarthSoft and edit this file in a text editor.
2.The following XML text will be present within the file (if not present, run EQuIS for AutoCAD and draw a spider diagram. This will generate the setting. The setting does not persist if AutoCAD is closed and reopened).
<Interface>
<AutoCAD>
<SpiderDiagrams>
<SpiderDiagrams>
<Node id="OnlyVisableLocations" value="False" />
</SpiderDiagrams>
</SpiderDiagrams>
</AutoCAD>
</Interface>
Replacing False with True will turn on the functionality.
Other Spider Diagram Settings
Like the Visible Locations setting above, other nodes can be added to the EarthSoft settings.xml within the directory C:\Users\[user_name]\AppData\Roaming\EarthSoft to customize Spider Diagrams:
•<Node id="HideTableHeader" value="True" />
oHides the table header
•<Node id="OutputReport" value="True" />
oBrings up a dialogue allowing the report to be saved in Excel prior to output.
•<Node id="EditReport" value="True" />
oAllows for changes in Excel to the report prior to loading in AutoCAD.
•<Node id="ExceedenceLocations" value="True" />
oApplies halos on top of existing locations with exceedances.
•<Node id="SpiderDiagramPosition" value="True" />
oSaves the location position.
Upon applying changes to the XML settings, the interface must be restarted.