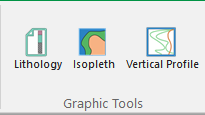
The Lithology tool creates a graphical representation of the lithology for a particular Location ID (select in Options pane) for the Facility you are currently logged into. |
|
The Isopleth tool creates a three-variable graph in which the horizontal axis shows time, the vertical axis shows depth/elevation, and the body of the graph shows the value of a given parameter. |
|
The Vertical Profile tool creates a vertical trend or line chart that displays one or more parameters at a specified location and time. |