LogPlot is a desktop log design and plotting program that allows you to create customized log formats. LogPlot also allows you to use one of the available log designs used in the petroleum, environmental, and mining industries. LogPlot allows you to create custom headers, display scale bars, lithologies, text descriptions, curves, histograms, pattern percents, symbols, fill bard, bitmaps, and well construction diagrams. Additionally, LogPlot features include: batch capability; English and Metric scaling; continuous log plotting and printing; curve wrapping/rescaling/truncating; export capabilities to bmp, jpg, wmf, and Windows clipboard, multiple pattern and symbol sets, context-sensitive help messages, on-line tutorials, toolbar buttons, and EZLog Wizard.
The GeologyEDD format may be useful in loading data through EDP for use in the LogPlot Interface.
Open EQuIS for LogPlot Interface
To open the EQuIS for LogPlot interface, click the LogPlot button ![]() (located in Graphics tab Plus section).
(located in Graphics tab Plus section).
Location Tab
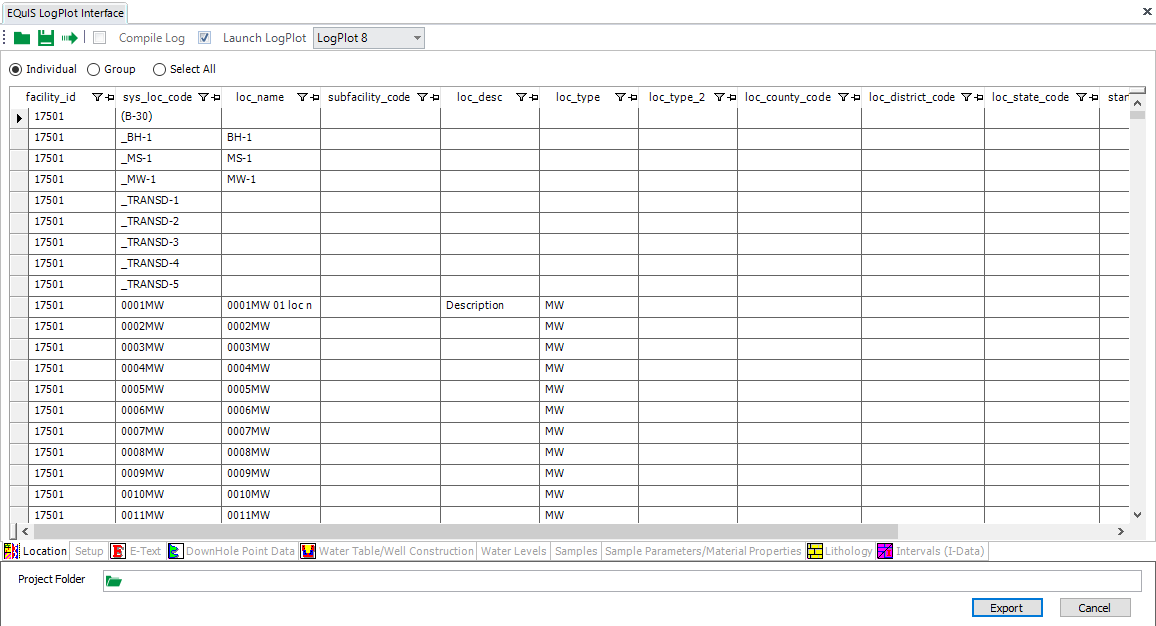
The default view when opening the EQuIS for LogPlot interface is the Location tab. This tab allows you to choose Individual,Groups, or All locations by selecting the buttons at the top of the Location Tab.
Tip: If you select Individual, then multiple locations can be selected by holding down the Ctrl key on your keyboard (for non-consecutive locations) or Shift (for consecutive locations) and then clicking the locations. |
Setup Tab
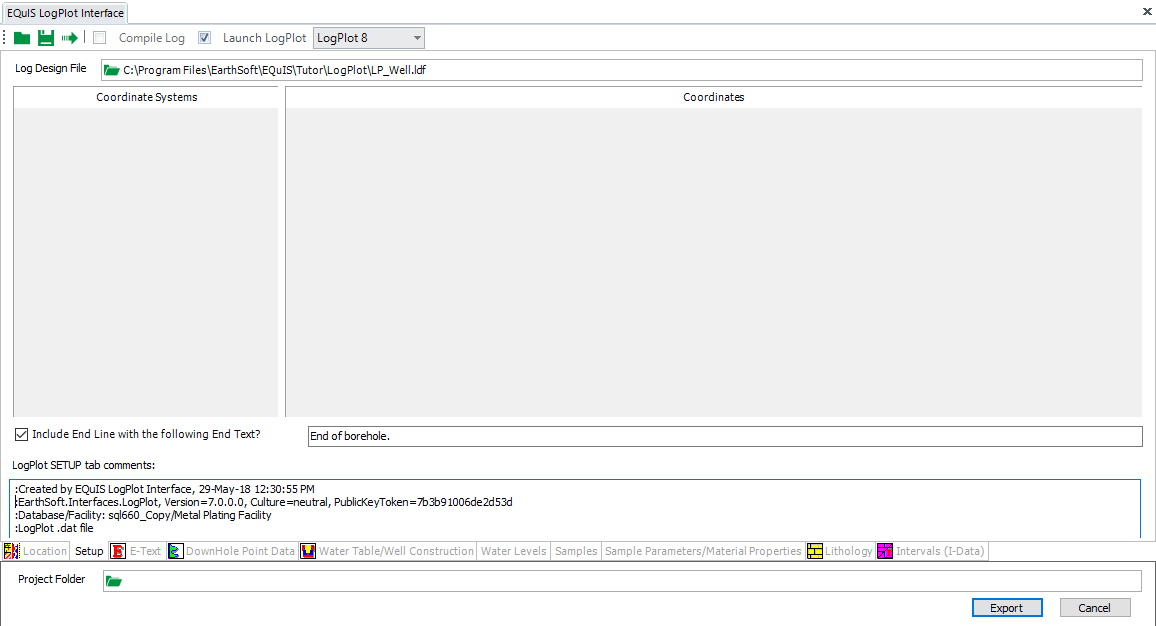
The SETUP tab allows you to select the coordinate system for data export as well as preview the selected location's coordinates prior to export. You can preview and edit the header information that will be exported to LogPlot's Setup Data tab, which is part of all LogPlot .dat files.
The SETUP tab is divided into several panes:
•Coordinate Systems pane — select Coordinate System in which to export spatial coordinate data (DT_COORDINATE.X_COORD, Y_COORD, and ELEV) into LogPlot.
•Coordinates pane — changes when the Coordinate System changes.
•LogPlot SETUP tab comments: pane — includes information that will be exported into LogPlot text file. Can be edited to include additional information, if desired.
If the Include End Line with the following End Text? check box is checked, EQuIS for LogPlot will export a horizontal line that will be plotted at the total depth of the location.
DownHole Point Data Tab
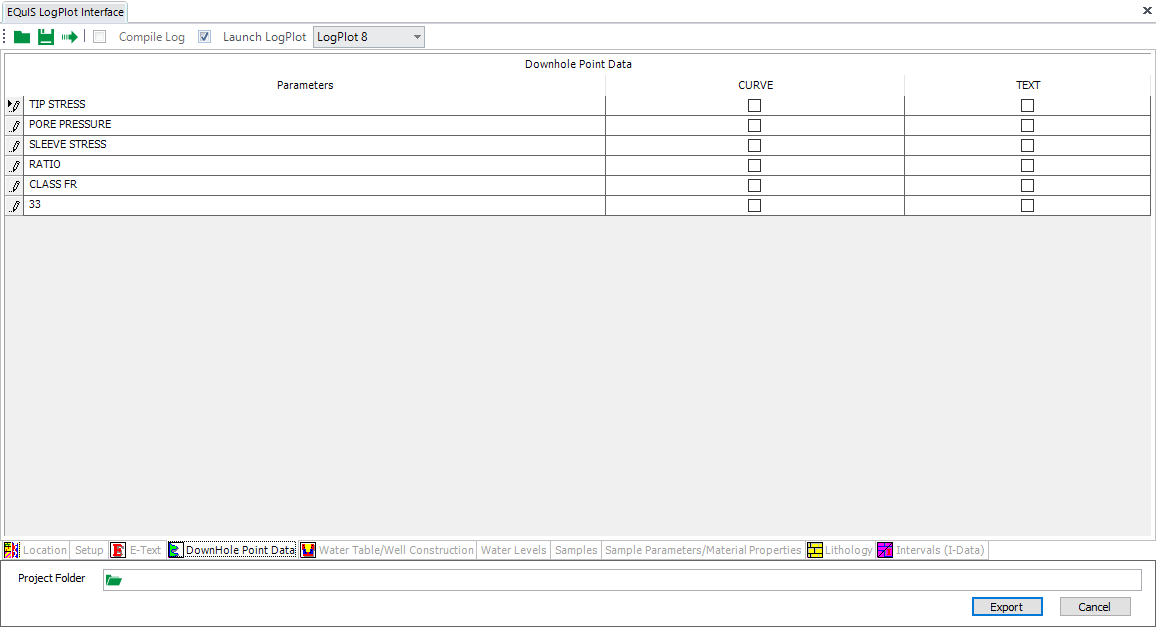
The Downhole Point Data tab allows you to select Downhole Point Data from DT_DOWNHOLE_POINT_DATA to be plotted in LogPlot. This data can be exported as Curve or Text data. Downhole point data is any data that is measured at a point such as CPT, and geophysical data. The values listed as parameters come from RT_DOWNHOLE_POINT_PARAM_TYPE. They can be exported as either Curve or Text entities.
Water Table/Well Construction Tab
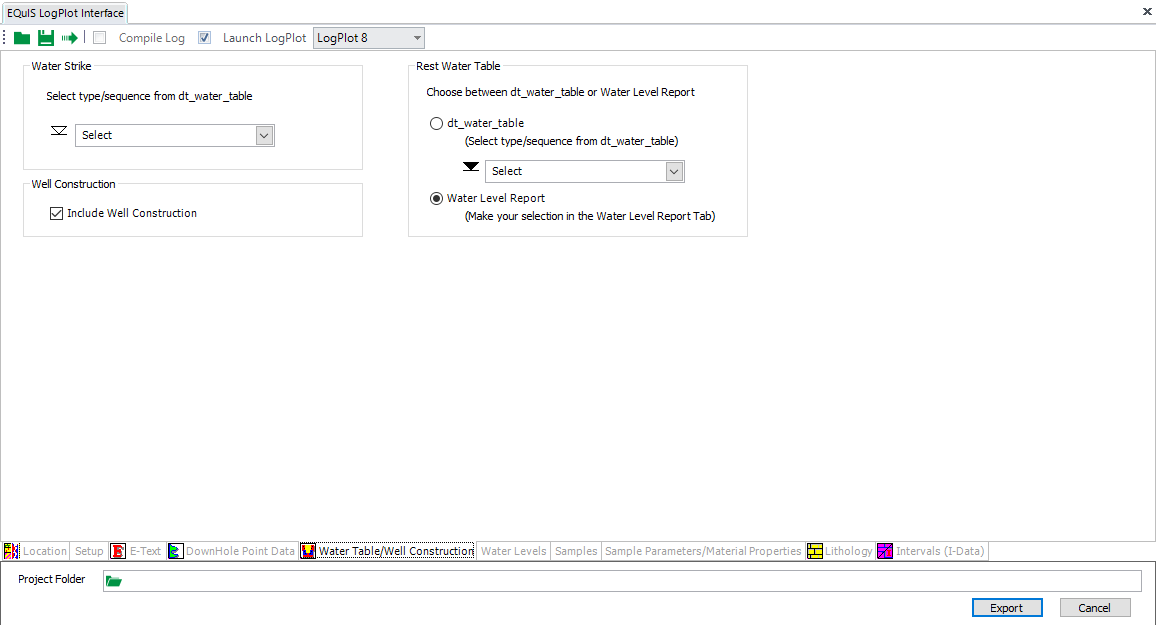
The Water Table/Well Construction tab allows you to select the water level(s) and the water level symbol(s) to export to LogPlot. This tab also allows you to export Well Construction information to LogPlot by checking or unchecking the Include Well Construction check box. If checked, EQuIS for LogPlot will populate the Water Level Symbol Column, the Well Construction Column, Well Description Text Column, and Well Materials Text Column in LogPlot.
Notes: •If more then one location is selected, the drop-down list for Static Water Table will be limited to type and sequence; the selection list will not be actual numeric values. •If there is no data in RT_PARAM_POINT_TYPE then this tab will not have any selection parameters. |
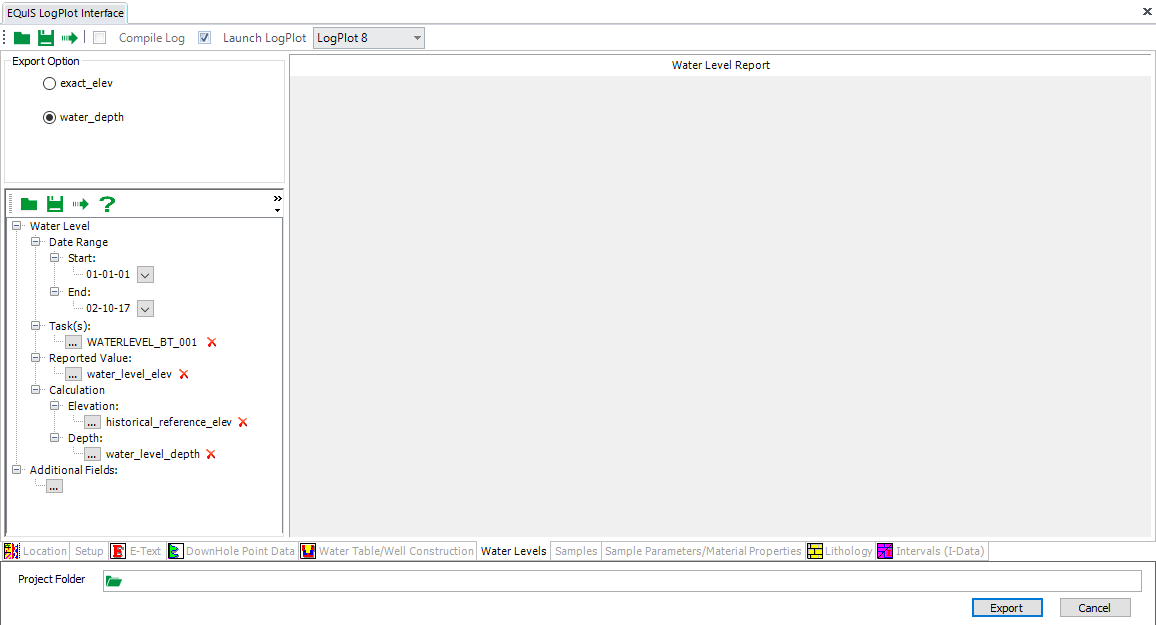
Water Levels Tab
E-Text Tab
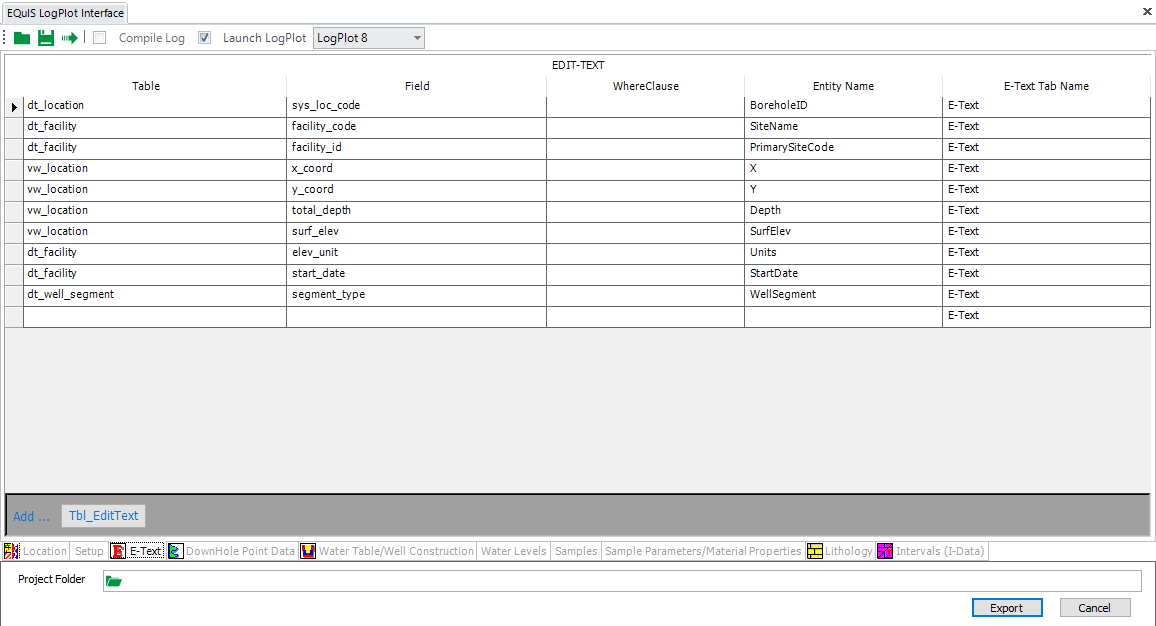
The E-Text tab allows you to designate information that will populate the EDIT-TEXT fields in the LogPlot data file — which correspond to EDIT-TEXT entities in the LogPlot Design File (LDF). Any field within EQuIS Professional can be used to populate E-Text. The fields that are selected in this tab will be exported to the Edit Text section of the LogPlot datafile. For example, the E-Text field in the EQuIS for LogPlot interface with an Entity Name of Project will populate the Edit Text field in LogPlot with the name Project in the LDF.
To change the fields that will be included in the LogPlot text file that is generated by the EQuIS LogPlot Interface, use the drop-down menus in the interface to select the desired Table and Field in the EQuIS Database.
To include fields in the LogPlot text file that is generated by the EQuIS for LogPlot interface, use the Add...EDIT-TEXT row button. This will populate the Project E-Text in the LogPlot data file.
To change the E-Text data elements for locations:
1. Point to the Table or Field columns and click the drop-down menu in the location you would like to change.
2. Entity Name corresponds to the name the entity will be given in the export to LogPlot. This name should be the same as the name given to the entity in your company's Log Design file (e.g. If you are exporting DT_LOCATION.SYS_LOC_CODE into LogPlot in order to populate the Location ID E-Text field, then the Entity Name should be Location ID).
Note: When exporting to 3rd party interfaces, use VW_LOCATION in the E-Text Table for X_COORD, Y_COORD. VW_LOCATION will automatically pull from the correct tables and format the data for the 3rd party interface. |
Samples Tab
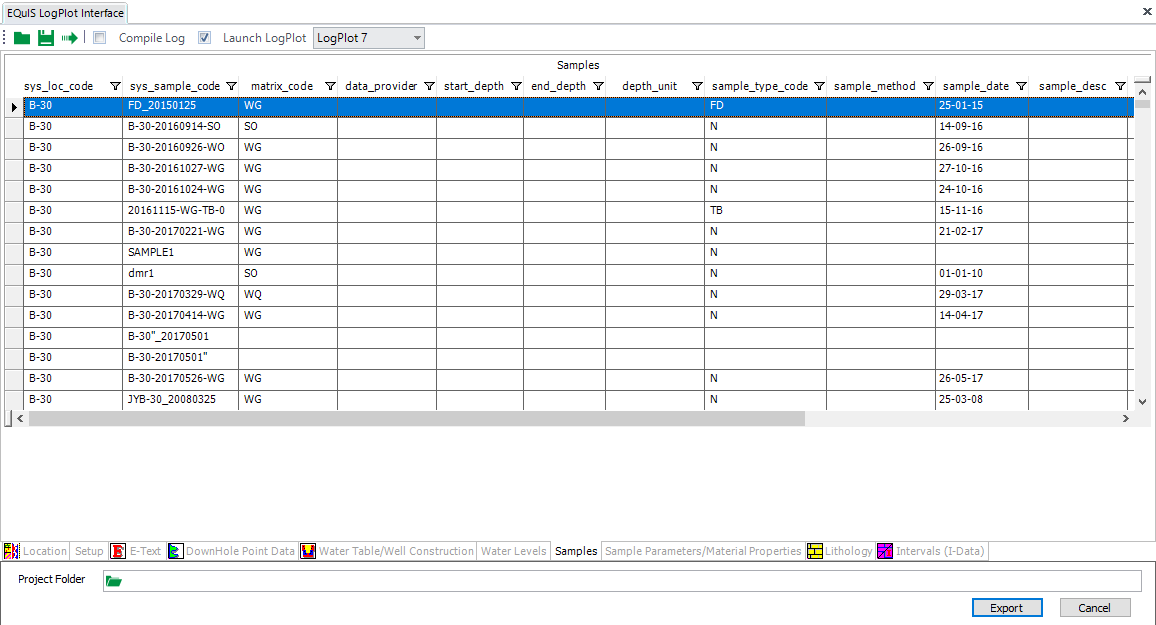
The Samples tab allows you to select the specific samples, blowcounts, sample parameters, and static material parameters to export to LogPlot. To select specific samples, use Filtering, the Ctrl key (for nonconsecutive locations) or the Shift key (for consecutive locations). Sample Parameters can be selected for export in a variety of formats.
The Samples tab is divided into several panes:
Samplespane |
Contains all of the samples associated with the selected location(s). Filter based on any of the parameters in this grid to determine which samples appear in a borehole log. Only the samples showing in the grid will be exported to LogPlot. |
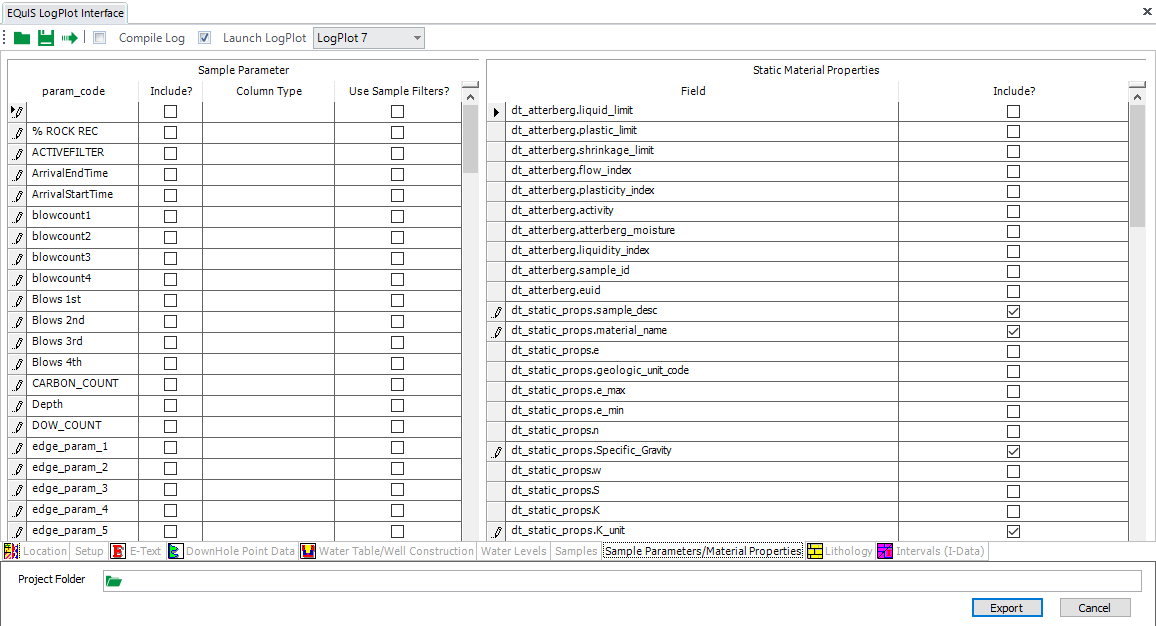
Sample Parameterpane |
Allows you to select data to be exported from DT_SAMPLE_PARAMETER as TEXT-COLUMN, VERT-TEXT, CURVE, HISTOGRAM, LITH, or FILLBAR entities. |
Static Material Propertiespane |
Allows you to select data to be exported from DT_ATTERBERG and DT_STATIS_PROPS. |
There are also several options that allow you to further specify how the information on the Samples tab will be exported:
Identify Sample By |
Determines whether the SYS_SAMPLE_CODE or SAMPLE_NAME will be exported to the data file. This option exists because SYS_SAMPLE_CODE must be unique (within a facility) and is frequently a long name. However, SAMPLE_NAME does not need to be unique, and the sampler may name samples {1, 2, 3, etc. in each borehole}. If you want to display 1, 2, 3 as the sample identifier on each log, then that name must be in DT_SAMPLE.SAMPLE_NAME and must be the SAMPLE_NAME option chosen. |
By midpoint?Check box |
Check box — exports all information related to the sample (name/code, sample parameters, blow counts) using the midpoint between the sample top and sample bottom as the depth associated with that information in LogPlot export. |
Blow Counts |
Determines how blow count information will be exported into LogPlot. |
Sample Parameter/Material Properties Tab
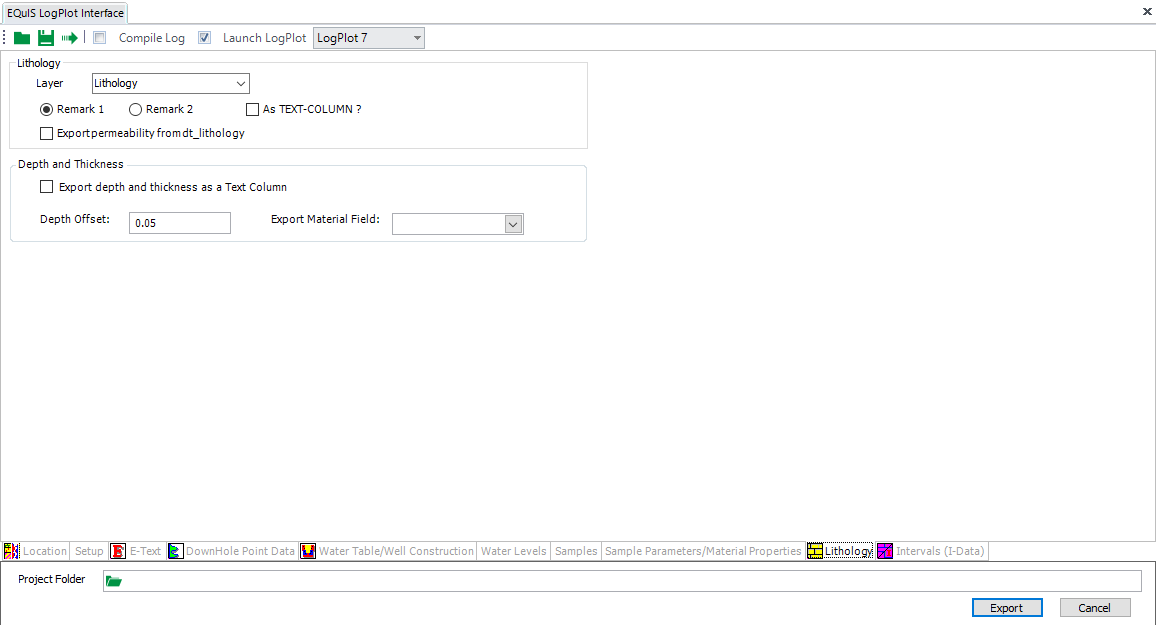
Lithology Tab
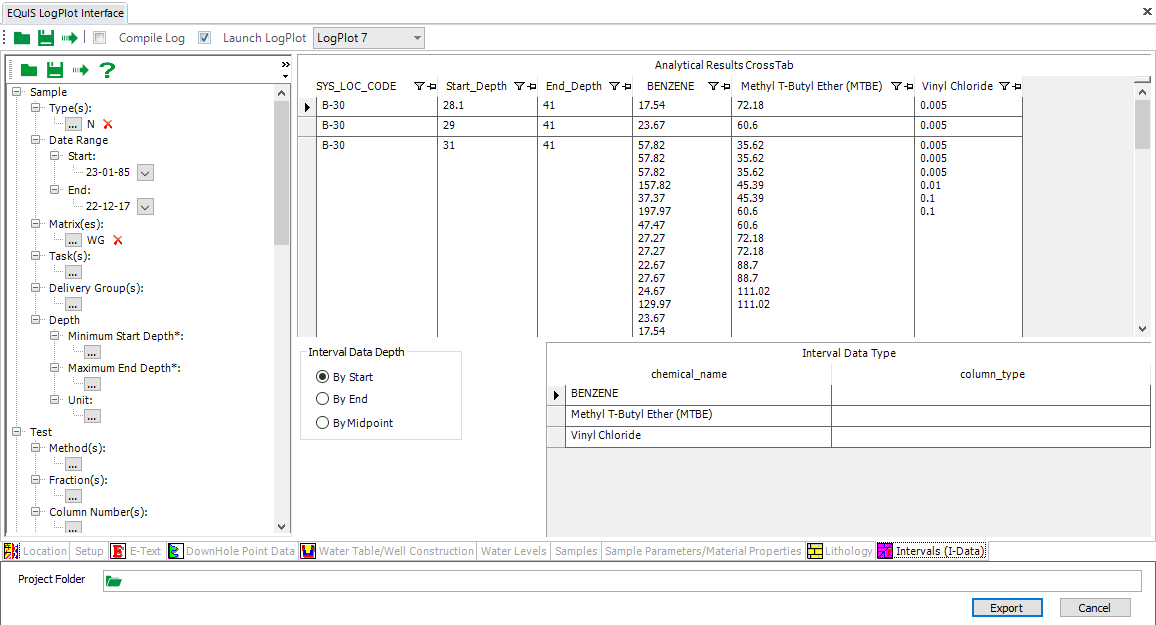
Intervals (I-Data) Tab
Launch LogPlot Check Box
The Launch LogPlot check box will create the LogPlot *.dat files and open LogPlot with your exported data displayed.
Note: It is not recommended to select the Launch LogPlot check box if you have selected Group on the Location tab. |
Compile Log Check Box
The Compile Log check box will create the LogPlot *.dat files, open LogPlot, and compile the Logs in LogView.
Note: A new column called USE_INNER_DIAM_YN has been added to RT_WELL_SEGMENT_TYPE. This column controls how the inner diameter is handled during a LogPlot export. If Y or null, the export will use the actual inner diameter entered in DT_WELL_SEGMENT.INNER_DIAMETER. If N, the export will set the inner diameter to zero so that any graphics will plot across the width of the well construction diagram to the outer diameter. |
EQuIS for LogPlot 8
Starting in EQuIS Professional 7, support for LogPlot 8 has been added. The only differences between using EQuIS for LogPlot 7 versus LogPlot 8 is when exporting the data to LogPlot. LogPlot 8 uses a different data file than was used previously in LogPlot 7. As data is exported from EQuIS, it is compiled into the new data format (.ldat8). EQuIS then launches the LogPlot 8 program and loads the appropriate data files from the current project. For existing data that is still in the old LogPlot 7 (.dat) format, it is possible to convert these data files from within the LogPlot 8 program.
Note: The compile log option is currently under development for LogPlot 8 and is disabled by default when using this version. |
LogPlot Version Selection
If multiple versions of LogPlot are found on the current machine, then an option is available to select which version will be used when exporting data. After data has been exported, this option will disappear and any further exports will be made using the previously selected version. In order to change versions after an export has been made, the EQuIS for LogPlot Interface needs to first be closed and then re-opened. Also, if there are not multiple version of LogPlot found on the machine, this option will be unavailable.
Office Hour Video
The Office Hour video EQuIS for ArcGIS and LogPlot can be viewed on YouTube.