|
<< Click to Display Table of Contents >> Navigation: EQuIS Library > Reports > EarthSoft Standard Reports > Water Level Reports > Water Level Elevation Trend Plot |
Report Name: Water Level Elevation Trend Plot (example)
File Name: EarthSoft.Reports.Library.07880.dll
Dependencies: N/A
Software: EQuIS Professional and EQuIS Enterprise
Source: EQuIS Professional install
Language: English
Output Type: .bmp, .png, .tiff, .wmf
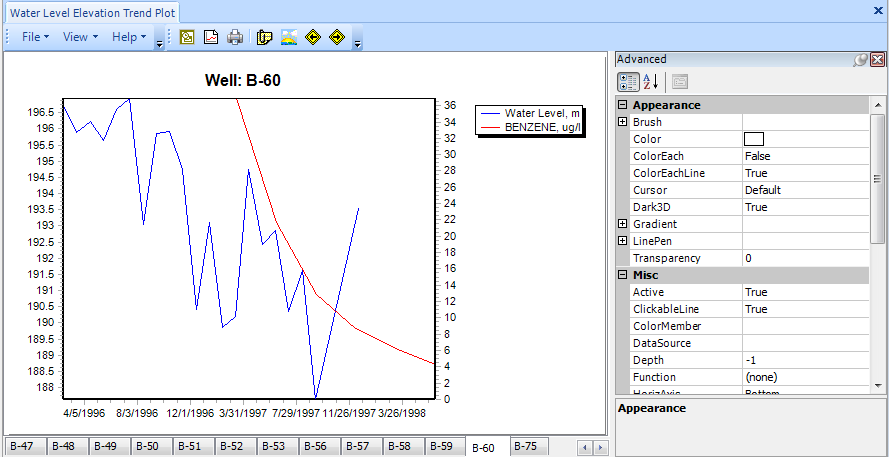
Description: The Water Level Trend Plot Report generates charts of water level elevations. In addition, an analyte can be added to water level charts. It uses Water Levels Report and Analytical Results Report to retrieve source data.
Installation Instructions: This report assembly is part of the EQuIS Professional installation. No additional installation steps are necessary. Thisreport cannot be published to the database.
Overview:
If Analyte is not selected, only the water level is plotted. If Analyte is selected but Unit is not selected or there are any unit conversion errors, an error message is displayed. If there are any missing data, e.g. missing X or Y value in a pair of X and Y measurements, or other unexpected issues, the errors are noted in the Errors tab.
Refer to XY Chart Basics: Chart Toolbar and XY Chart Basics: Chart Editor of XY Charts of XY/XYZ Charts for more information.
Tables: The tables used by Water Levels Report and by Analytical Results II
Report Parameters |
||||||||||||
|---|---|---|---|---|---|---|---|---|---|---|---|---|
|
||||||||||||
* This report includes the hidden parameter: Water Level (default is exact_elev). |
Report Output |
|---|
Trend plot |
Copyright © 2022 EarthSoft, Inc • Modified: 12 May 2020