Use the Map widget to:
•Display multi-layered map with facility locations;
•View map and features in three dimensions (3D);
•Interact directly with features on the map, such as clicking on the map to view additional information;
•Interact with other reporting widgets;
•Display report output on the map; and
•Display georeferenced documents and photographs on the map.
The Map widget allows the user to display a map using Esri ArcGIS API for JavaScript (JS). Please review the ArcGIS API licensing information before using this widget.
Esri JS API Requirements: 4.20 (https://js.arcgis.com/4.20)
Widget Interface
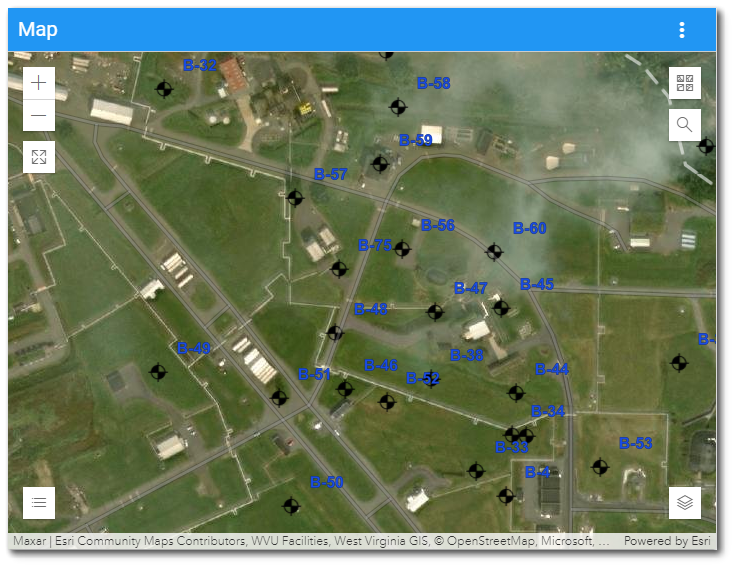
The widget displays a multi-layered map with facility locations (as defined in VW_LOCATION), report output, and other map layers. By default, the Map widget displays layers in two dimensions (2D).
Note: The Map widget will convert elevation units to: •DT_FACILITY.ELEV_UNIT, •DT_LOCATION.UNITS, or •DT_COORDINATE.ELEV_UNIT. The first non-null value will be selected from this list. |
|---|
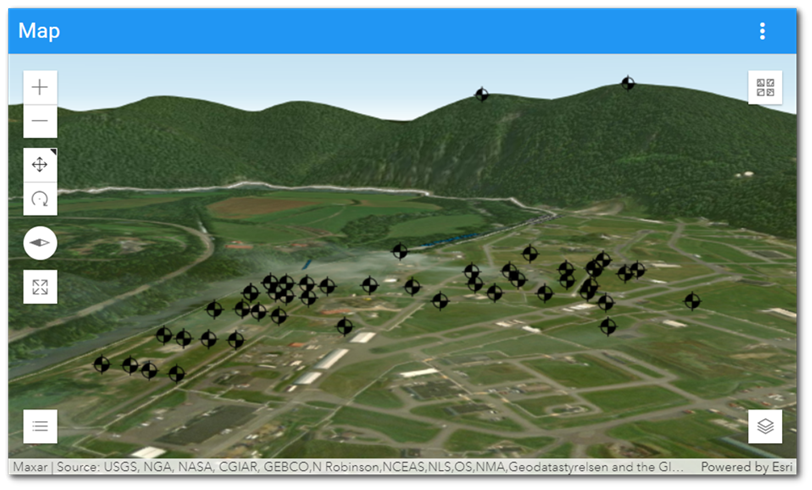
Users can select an option in the Widget Editor to display the map layers in 3D. When checked, the map will render in 3D and additional tools are available on the map to allow different view perspectives by panning and rotating. For layers that include Z coordinate data, features may be rendered above or below the map’s surface. It is possible to rotate the map view to see sub-surface features.
Popups
Popups can be defined to display when a user selects a location on the map. The Popup Window can display data, images, charts, crosstabs, and other information.
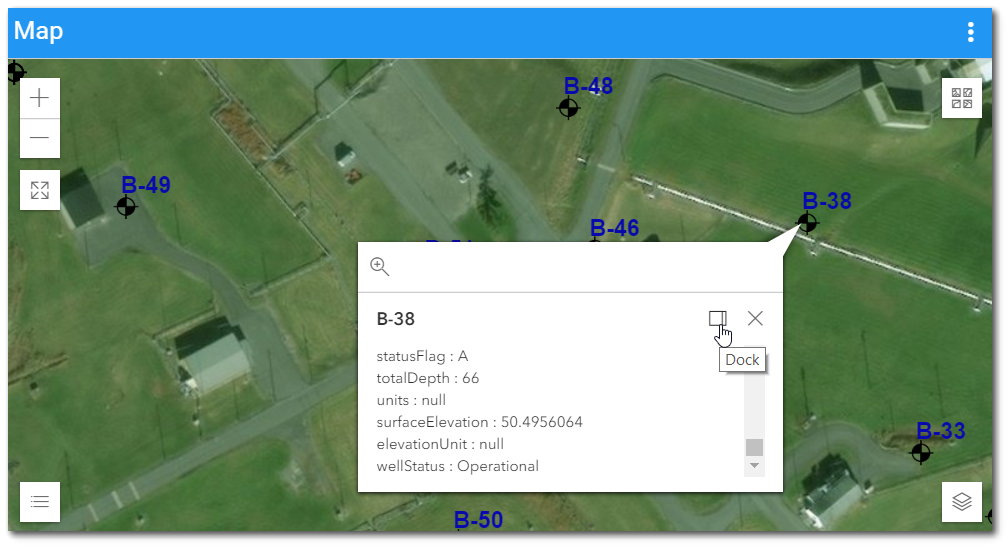
By default, the Popup Window has a leader to the selected location, however, it can be docked to the frame of the Map widget by selecting the Dock icon in the Popup Window. Once the Popup Window is docked, clicking on any other location will populate the Popup Window for that location. Select the Undock icon to undock the Popup Window or the Close icon to close the Popup Window.
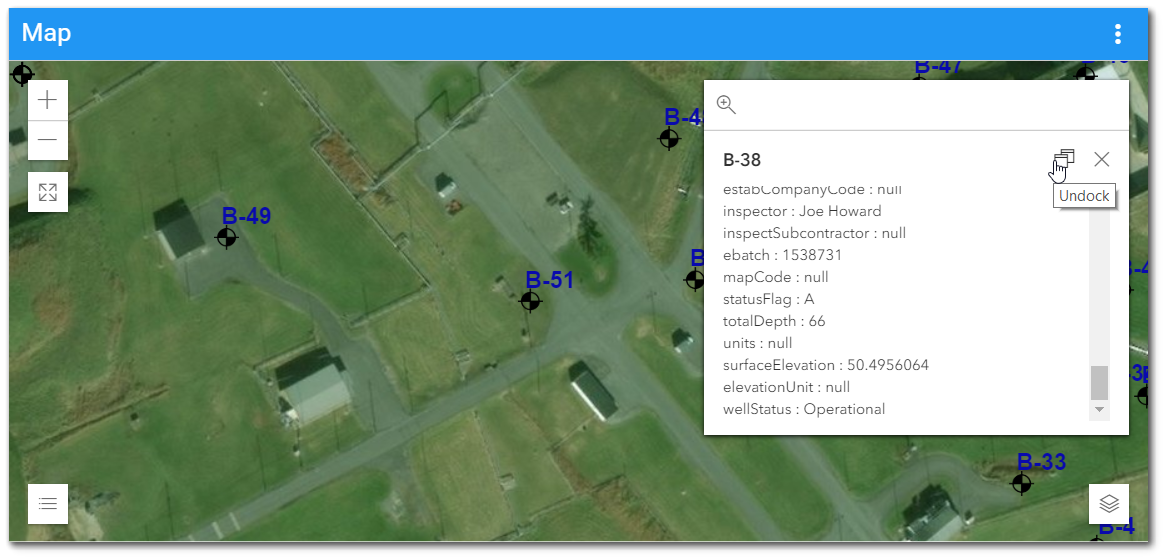
Image files (e.g., PNG, JPG, GIF, SVG) associated with a location will display as a thumbnail in the Map Widget Popup Window. Image files can be associated to a location and uploaded via the Explorer widget. See the Upload File section of the Explorer Widget article.
Map Controls
The Map widget has the following functions in the user interface that can be set on the User Interface tab in the widget properties:
•Zoom In and Zoom Out – Although the default view extents for the map can be set, the user can always change how much of the map is displayed. Click either the Zoom In (![]() ) or Zoom Out (
) or Zoom Out (![]() ) buttons to view the page as needed. These buttons are located on the top-left of the widget. Users can also zoom in and out by using the scroll button on the mouse.
) buttons to view the page as needed. These buttons are located on the top-left of the widget. Users can also zoom in and out by using the scroll button on the mouse.
•Fullscreen – Click the Enter Fullscreen ![]() button to expand the map to the extent of the user's screen. Selecting the Exit Fullscreen
button to expand the map to the extent of the user's screen. Selecting the Exit Fullscreen ![]() button, hitting escape on the keyboard, or hitting F11 on the keyboard will exit full screen and return to the dashboard.
button, hitting escape on the keyboard, or hitting F11 on the keyboard will exit full screen and return to the dashboard.
•Layer List – Select the Expand the Layer List ![]() button to display a list of layers and sub-layers added to the map. Layers can be toggled on and off by selecting the View
button to display a list of layers and sub-layers added to the map. Layers can be toggled on and off by selecting the View ![]() icon for the layer. Click the Open
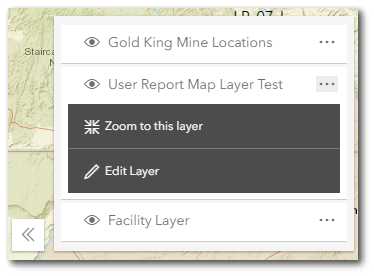
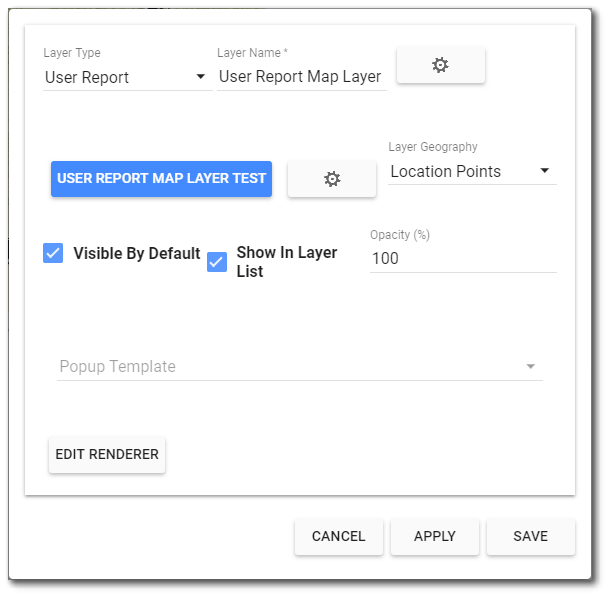
icon for the layer. Click the Open ![]() icon for a layer to display a menu that allows zooming to the layer or editing the layer. Selecting Edit Layer will display an editing window that allows users to edit the layer without having to open the Widget Editor. Users can apply the changes in the current window or save them to persist next time the widget is opened. Click on the Collapse
icon for a layer to display a menu that allows zooming to the layer or editing the layer. Selecting Edit Layer will display an editing window that allows users to edit the layer without having to open the Widget Editor. Users can apply the changes in the current window or save them to persist next time the widget is opened. Click on the Collapse ![]() icon to close the drop-down menu.
icon to close the drop-down menu.
|
|
|---|
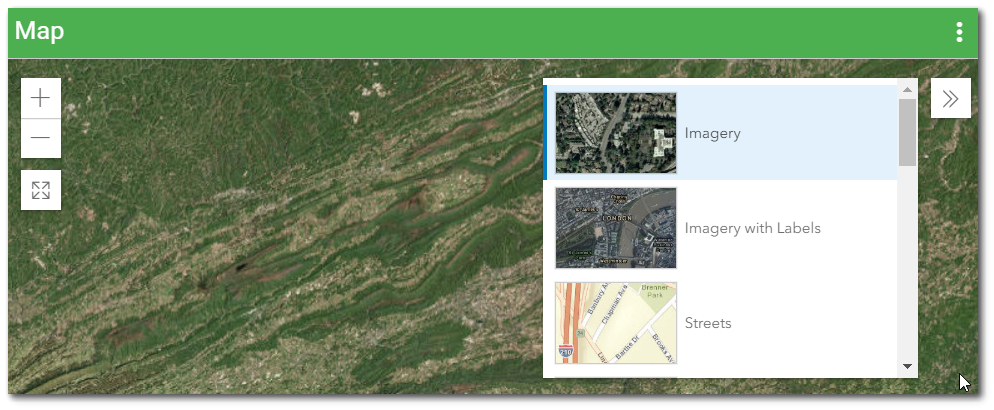
•Basemap Gallery – A variety of map types are available within Enterprise. Select the Basemap Gallery ![]() button to open the drop-down selection of map types. The current options are ArcGIS defaults types. Click on the Collapse
button to open the drop-down selection of map types. The current options are ArcGIS defaults types. Click on the Collapse![]() icon to close the drop-down menu.
icon to close the drop-down menu.
The default basemaps are stored in the ST_CONFIG table. Acceptable entries for the default basemaps are as follows:
Basemap Gallery Name |
ST_CONFIG Table Entry |
|---|---|
Imagery |
satellite |
Imagery with Labels |
hybrid |
Streets |
streets |
Topographic |
topo |
Dark Gray Canvas |
dark-gray |
Light Gray Canvas |
gray |
National Geographic |
national-geographic |
Terrain with Labels |
terrain |
Oceans |
oceans |
OpenStreetMap |
osm |
USA Topo Maps |
topo-vector |
USGS National Map |
streets-relief-vector |
•Search – The Search functionality is disabled by default and can be enabled selecting the "Enabled" checkbox on the User Interface tab in the Map Widget Editor. The Search ![]() option allows the user to search for geographic locations (e.g., address) on the map. This option does not search for EQuIS data. Click on the Collapse
option allows the user to search for geographic locations (e.g., address) on the map. This option does not search for EQuIS data. Click on the Collapse![]() icon to close the search box.
icon to close the search box.
•Legend – When a layer is added to the map, the Legend![]() button can be selected to view a drop-down list of map symbols. Click on the Collapse
button can be selected to view a drop-down list of map symbols. Click on the Collapse![]() icon to close the drop-down menu.
icon to close the drop-down menu.
When the "Use 3D" option is checked, the following additional controls display on the map:
•Toggle to Pan or Rotate in 3D – Click the Pan ![]() button to move the map horizontally and vertically without changing the extent or the compass orientation. Click the Rotate
button to move the map horizontally and vertically without changing the extent or the compass orientation. Click the Rotate ![]() button to adjust the angle and compass orientation of the map view.
button to adjust the angle and compass orientation of the map view.
• Reset Compass Orientation – Click on the Reset Compass Orientation ![]() button to reset the compass orientation to point north.
button to reset the compass orientation to point north.
Interaction with Other Widgets and Filters
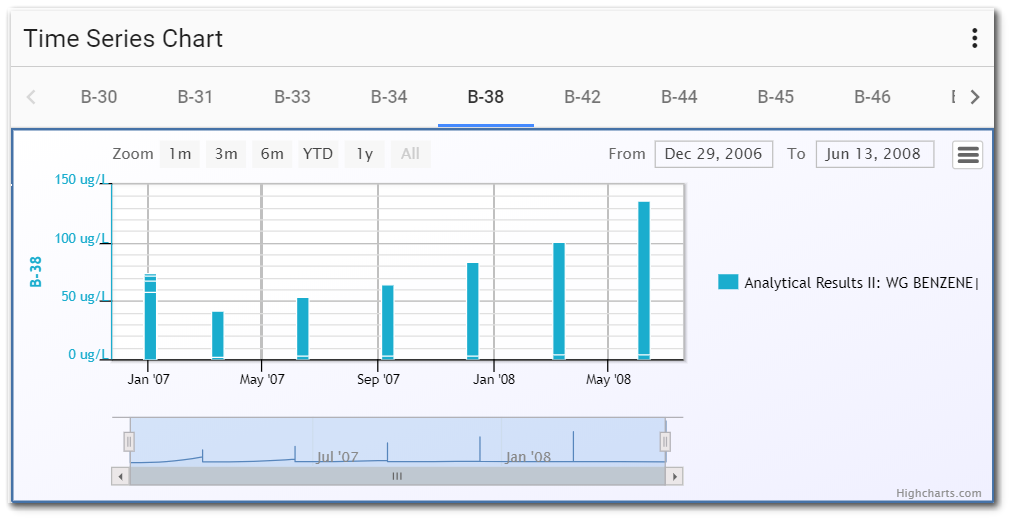
When a location on the Map widget is selected and the Time Series Chart widget is setup to separate charts by SYS_LOC_CODE, the time series chart will automatically adjust to the selected location.
|
|
|---|
The Map widget allows the EZView widget to add a report layer onto the map. Users can drag and drop a valid (mappable) report from the EZView widget to a Map widget by dragging the report name from the EZView widget onto the map. The map will zoom to the extent of the report and display points for the report locations. This report layer will appear until the widget is refreshed.
The Dashboard Filter widgets allow the user to select a parameter value and filter the report output of reporting widgets (e.g., Map widget) on the dashboard. When the Filter-List widget filters on Location, the Map widget will display only the filtered locations or location groups. This function only works for report layers and does not apply to the facility layer.
Note: Due to the asynchronous nature of filtering and layer loading within the Map widget, the Map widget may create duplicates of layers if a user filters the dashboard quickly and does not allow the Map widget to finish loading. Users who experience this issue can fix it by simple refreshing the Map widget after filtering. |
|---|
Widget Properties
Use the Widget Editor to change the properties of the Map widget. The widget properties are divided into six tabs (General, Layers, Labels, Symbology, Extents, and User Interface) in the Widget Editor and are each described in separate help articles.